Macroeconomic overview
The GDP fall in 2009 is estimated at 7.9% compared to 2008 (growth at 5.6% in 2008 against 2007). It amounted to RUR39063.6 bn (USD1233.1 bn) in 2009. The deflator index in 2009 is 102.3. Russia’s exports of goods decreased from USD471.6 bn 2008 to USD303.4 bn in 2009 according to the RF Central Bank data. Total merchandise exports of Russia decreased by 35.7% in 2009 compared to 2008 (in 2008 their growth was 33.1% against 2007).
Index of output of five basic economic sectors (industry, construction, agriculture, transport, retail trade) was 90.6 in 2009 as compared with 2008 (104.3 in 2008 compared to 2007). Index of industrial output was 89.2 in the same period (102.1 in 2008 against 2007).
Figure 1
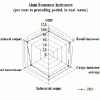
The main stable internal source of expanding final consumption and consequently production is growing real incomes of population. But real disposable incomes of population went up by 2.3% in 2009 compared to their rise at 1.9% a year before. Real wages decreased by 2.8% in 2009 as against their growth at 11.5% a year before; this means real disposable incomes grew in 2009, whereas wages and salaries fell down. Low increase of real disposable incomes brings falling imports of competing consumer goods against a background of real effective rouble depreciation lately. Real effective depreciation of ruble against the basket of foreign currencies of the RF trade partners is 5.6% in 2009 against 2008 (appreciation at 5.1% in 2008 compared to 2007). Real ruble depreciation against USD is 12.2% in 2009 as compared with 2008, while real rouble depreciation against EUR is 8.3% in the same period. Index of consumer prices was 111.7 in 2009 as compared with 2008 (114.1 in 2008 compared to 2007); it reached 108.8 in December 2009 against December 2008.
In accordance with the official revised estimation, imports share in saleable resources of retail turnover was 44% in 2008 and amounted to 41% in 2009.
According to the RF Central Bank, total merchandise imports of Russia amounted to USD191.8 bn in 2009 and decreased by 34.3% compared to their rise at 30.6% in 2008 (USD291.9 bn). Another source of final consumption – capital inflow is not stable enough. According to the RF Central Bank revised estimates, there was net private capital outflow at USD132.8 bn in 2008. Net private capital outflow amounted to USD56.9 bn in 2009. Low world prices of Russian major export commodities led to drop of incomes of legal entities and considerable overall investment fall – 16.2% reduction in 2009 compared to 9.8% increase in 2008.
Industrial output fell by 10.8% in 2009 as against its rise at 2.1% in 2008, cargo turnover of transport companies fell by 10.2% as compared with its rise at 0.7%, accordingly.
Among other branches of Russia's economy the communication sector expanded by 2.7% in 2009 compared to 2008 (11.9% in 2008 against 2007).
Retail turnover fell in 2009 by 5.5% as against its rise at 13.5% in 2008, while real disposable incomes went up by 2.3% and real wages went down by 2.8%, accordingly. The volume of services rendered to natural entities went down by 4.2% in 2009 compared to its growth by 4.8% in 2008. Consumer prices index in December 2009 reached 108.8 compared to December 2008, that is less than in December 2008 (113.3) compared to December 2007 and less than the schedule stipulated by the RF budget initial guidelines for 2009 (113.0). Prices of foodstuffs (106.1) increased less than those of non-food goods (109.7) and services (111.6) in 2009. Prices of natural gas (24.1%) and electricity (24.9%) as well as transport (6.5%), housing and communal services (19.6%) for natural entities cause further increase of prices of nearly all other goods. Index of industrial producer prices was 113.9 in December 2009 compared to December 2008 (93.0 in December 2008 against December 2007) or was higher than consumer prices index by 5.1 per cent points. The index of consumer prices in the whole 2009 was 111.7 as against 2008 (114.1 in 2008 compared to 2007). Consumer prices index reached 103.2 in March 2010 against December 2009.
The formal indicator of money supply (M2) growth increased in 2009 by 16.3% (up to RUR15697.7 billion as on January 1, 2010) against January 1, 2009.
The main developments in the financial sphere of Russia were caused in 2009 by falling surplus of supply over demand of foreign exchange at the foreign currency market in result of diminishing exports of Russian raw materials. The world economic crisis brought fall in prices of Russia’s major export commodities, huge capital outflow and consequent fall of Russian ruble exchange rate. Demand for foreign exchange is also increasing due to repayment of still large amounts of external debts (the total amount of external debt liabilities, including those of the private sector) is estimated by the RF Central Bank at USD152 bn in 2009.
Russia's gold and foreign exchange reserves amounted to USD439.0 bn by January 1, 2010. That was by 2.8% more than in January 1, 2009 – USD427.1 bn. They went up to USD447.0 bn by April 1, 2010.
Total proficit of the federal budget is estimated at 4.1% of the GDP in 2008 as against 5.4% in 2007. The total deficit of the federal budget is estimated at RUR2300.1 bn in 2009 or 5.9% of the GDP.
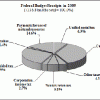
Overall federal budget revenue in 2009 amounted to RUR7336.8 bn (USD231.6 bn). Execution of the federal budget can be appraised as satisfactory, as the 2009 revised plan for collecting revenues was fulfilled at 109.3% in 2009.
In 2009 collection of export and import duties, VAT and excises on import reached RUR3519.76 bn (USD111.1 bn). But only RUR2683.3 billion (USD84.7 bn) were received by the federal budget in 2009 compared to RUR3584.9 bn (USD144.5 bn) in 2008. This means that RUR836.5 bn were transferred to the RF Reserve Fund and the Fund of National Prosperity. The share of customs payments in the federal budget total revenues comprises 36.6% in 2009 against 38.6% in 2008.
Figure 2
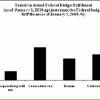
Figure 3
Debt servicing payments exert less pressure upon the federal budget expenses in 2009 than a year before. The overall interest payments due to the public debt reached RUR176.2 bn (USD5.6 bn) or 1.8% of total federal budget expenses in 2009 as compared with 2.0% in 2008. The RF Government fulfilled the 2009 plan on servicing the public debt in 2009 at the level of 86.9% by January 1, 2010. The revised plan on debt servicing payments in the federal budget was RUR202.8 bn in 2009.
The size of the RF Reserve fund amounted to RUR1830.5 bn (USD60.5 bn) by January 1, 2010, that of the Fund of the National Prosperity – to RUR2769.0 bn (USD91.6 bn), accordingly. By April 1, 2010 the size of the size of the RF Reserve Fund amounted to RUR1553.3 bn (USD52.9 bn); that of the Fund of the National Prosperity – to RUR2630.7 bn (USD89.6 bn).
As for the 2010 economic indicators, in May 2010 government official experts estimate the RF GDP growth at 3.5-4.0% and inflation growth at 6.5-7.5%.
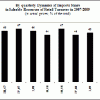
The share of import goods in retail trade resources was 45% in Q1 2009, 40% in Q2 2009, 41% in Q3 2009 and 39% in Q4 2009 in accordance with the official revised data.
Figure 4
Evolution of home demand
Personal income and consumer market trends
Real disposable money incomes of population increased by 2.3% in 2009 compared to 2008 when there was rise at 1.9% (real disposable money income takes into account consumer price index growth, taxes and other obligatory payments).
Average monthly salary reached RUR18785 in 2009 (USD593) or increased by 8.5% in nominal terms and decreased by 2.8% in real calculation compared to 2008. Total wage arrears stood at RUR3.565 bn (USD117.9 bn) as of January 1, 2010 and went down by 23.7% from RUR4.674 bn (USD159.1 bn) a year before. State wage arrears (employees financed by budgets of all levels) made up RUR196 mln by January 1, 2010 or 5.5% of total wage arrears and decreased by 24.9% compared to January 1, 2009. In the structure of money income formation in 2009 the shares of incomes due to wages and salaries, as well as social transfers incomes went up compared to 2008. At the same time the share of incomes due to business and property transfers went down. The share of wages and salaries increased to 69.4% in 2009 against 68.3% in 2008. Social transfers went up among the sources of money incomes of Russia's population: 14.6% in 2009 as against 13.2% in 2008. The share of incomes due to business in 2009 decreased to 9.7% from 10.3% in 2008. At the same time the share of incomes due to property decreased from 6.2% to 4.3%. The share of other incomes was 2.0% in 2009 as in 2008.
Table 1 Personal Income and Its Disposition: 2004-2009
|
Item
|
2004
|
2005
|
2006
|
2007
|
2008
|
2009
|
| Personal income, billion roubles in current prices |
10930
|
13522.5
|
17267.3
|
21308.6
|
25561.2
|
28435.7
|
|
of which (%)
|
|
|
|
|
|
|
|
Wage and salary disbursements1
|
64.9
|
64.8
|
64.9
|
67.5
|
68.6
|
69.4
|
|
Social transfers
|
12.9
|
12.9
|
12.0
|
11.6
|
12.8
|
14.6
|
|
Other income
|
22.2
|
22.3
|
23.3
|
20.9
|
18.6
|
16.02
|
| Disposal of personal income |
|
|
|
|
|
|
|
of which (%)
|
|
|
|
|
|
|
|
Personal consumption expenditures
|
69.8
|
71.1
|
69.0
|
69.6
|
73.2
|
69.1
|
|
Personal obligatory payments
|
9.1
|
9.6
|
10.5
|
11.8
|
13.0
|
10.7
|
|
Personal saving
|
11.0
|
9.5
|
10.3
|
9.6
|
5.8
|
14.5
|
|
Currency acquisition
|
8.3
|
8.7
|
6.8
|
5.2
|
7.8
|
5.5
|
|
Increase of cash roubles at personal disposal
|
1.8
|
1.1
|
3.4
|
3.8
|
0.2
|
0.2
|
- Including non-official salary disbursements.
- Including income due to entrepreneurship (9.7%), property (4.3%) and other income (2.0%).
Source: Federal Service of State Statistics.
In 2009 the share of purchase of goods and services was 69.1% (purchase of goods – 53.6%, services – 15.5%) in money income disposal and decreased by 5 per cent points compared to 2008. Meanwhile the share of personal savings went up from 5.3% in 2008 to 14.5% in 2009. The share of cash currency purchase (5.5%) went down compared to 2008 (7.9%). At the same time the tax burden on natural entities (share of personal tax and other obligatory payments) went down in 2009 to 10.7% as compared with 12.3% in 2008.
The size of money savings of natural entities (without savings on foreign exchange accounts and cash foreign exchange) rose from RUR7773.0 bn (USD264.6 bn) at the start of 2009 and reached RUR9093.9 bn (USD300.7 bn) by January 1, 2010.
By January 1, 2010 the money savings included RUR5496.9 bn as bank deposits (60.4% of the total), RUR2717.0 bn in cash (29.9%) and RUR880.0 bn in various securities (9.7%).
Social economic differentiation of Russia's population slightly decreased in 2009 compared to 2008, as the top 10% concentrated 31.0% of total money incomes (31.1% in 2008) and the least 10% received only 1.9% (1.9%); this making the difference between the average incomes of the former and the latter groups (the so called co-efficient of funds) at 16.7 times in 2009 compared to 16.8 in 2008. The aggregate share of social layers above the survival level (the share of people having per capita monthly incomes more than RUR6000) in distribution of the overall income increased from 77.9% in 2008 up to 82.2% in 2009.
Table 2 Distribution of Russian Population by Size of per capita Money Income
|
|
2008
|
2009
|
| Population, total |
100.0
|
100.0
|
|
of which with per capita income per month, roubles
|
|
|
|
below 2000 (below USD 63)
|
1.5
|
1.0
|
|
2000.1-4000 (USD 63-126)
|
8.4
|
6.5
|
|
4000.1-6000 (USD 126-189)
|
12.2
|
10.3
|
|
6000.1-8000 (USD 189-253)
|
12.3
|
11.1
|
|
8000.1-10000 (USD 253-316)
|
10.9
|
10.4
|
|
10000.1-15000 (USD 316-473)
|
20.2
|
20.4
|
|
15000.1-25000 (USD 473-789)
|
19.8
|
21.8
|
|
over 25000 (over USD 789)
|
14.7
|
18.5
|
Note: Comparison in US dollars applicable only to figures for 2009. Conversion of RUR into USD is based on the official period average rate of the Central Bank.
Source: Federal Service of State Statistics.
As compared with 2008, purchasing power of the average per capita money income in 2009 increased for eggs, sunflower oil, margarine, potatoes, fresh cabbage, bread, wheat flour, groats and butter; whereas it went down for beef, milk, fish, sugar, rice, apparel, housing, communal and transport services, except telephone communication.
State of business and investment
The overall number of registered legal entities as of January 1, 2010 totaled 4907.8 thousand, of which 1846.3 thousand (37.6%) were in trade and repair services and 464.7 thousand (9.5%) were busy with industrial activity. Public and municipal companies (382.8 thousand) accounted for 7.8% of the total. The overall number of registered legal entities went up by 2.8%, the number of the entities concentrated in trade and repair services increased by 2.7% and the number of the entities dealing with industrial output also rose by 2.3% as against January 1, 2009.
Net income (gross profits minus losses) of Russian enterprises and organizations (legal entities, excluding small business, banks, insurance and budget organizations) in 2009 reached RUR4300.5 bn (USD138.7 bn) or was 114.2% of the 2008 result. The share of legal entities reporting losses was at the level of 30.1% in 2009; i.e. it was by 4.9 per cent point more than in 2008. Gross profits of 46.5 thousand companies totaled RUR5356.2 bn (USD172.8 bn), while 20.0 thousand companies reported losses at RUR1055.7 bn (USD34.0 bn).
The main leaders are companies of major export-oriented industries (fuel, ferrous and non-ferrous metal industries) – 45.2% of total net income; the outsiders concentrate in output of vehicles, woodworking, housing and communal services.
As on January 1, 2010 total indebtedness of legal entities amounted to RUR32516.6 bn (USD1075.3 bn), including RUR1098.3 bn (USD36.3 bn) overdue. The latter indicator represented 3.4% of total indebtedness compared to 3.8% a year ago. By January 1, 2010 total creditor indebtedness was RUR14842.9 bn (USD490.8 bn), including RUR956.2 bn (USD31.6 bn) overdue (6.4% of total creditor indebtedness as against 7.4% as on January 1, 2009). The structure of overdue creditor indebtedness was as follows: 71.2% - to suppliers, 8.6% - to state budgets of all levels, 4.1% - to state non-budget funds. Total creditor indebtedness to banks and other financial institutions was RUR17673.7 bn (USD584.4 bn) of which RUR142.1 bn (USD4.7 bn) or 0.8% overdue compared to 0.5% a year ago.
As on January 1, 2010 total debtor indebtedness showed RUR15420.3 bn (USD509.9 bn), including RUR1010.5 bn (USD33.4 bn) overdue (6.6% of total debtor indebtedness compared to 7.6% a year before).
Table 3 Gross Fixed Investment, by Economic Branch: 2003-2009
|
|
2003
|
2004
|
20051
|
20061
|
20071
|
20081
|
20091
|
| Total, bn roubles in current prices |
2186.4
|
2729.8
|
2688.42
|
3533.22
|
4908.22
|
6272.12
|
5769.82
|
|
of which (%):
|
|
|
|
|
|
|
|
|
Industry
|
36.4
|
41.0
|
40.6
|
41.5
|
41.7
|
42.0
|
42.23
|
|
Agriculture
|
4.0
|
3.1
|
3.2
|
4.0
|
4.3
|
3.9
|
3.3
|
|
Construction
|
4.3
|
3.3
|
2.9
|
3.3
|
2.4
|
2.4
|
2.8
|
|
Transport
|
18.4
|
20.2
|
22.1
|
21.3
|
20.2
|
21.9
|
25.0
|
|
Communications
|
4.8
|
6.5
|
6.7
|
5.5
|
5.1
|
4.1
|
3.1
|
|
Trade and catering
|
4.2
|
2.6
|
3.1
|
3.3
|
3.3
|
2.7
|
2.8
|
|
Housing
|
13.2
|
8.4
|
11.5
|
10.0
|
12.0
|
11.7
|
9.6
|
|
Other economic branches
|
14.7
|
14.9
|
9.9
|
11.1
|
11.0
|
11.3
|
11.2
|
- Large and medium size enterprises only.
- Less VAT.
- Including 30.2% of investments into fuels and energy sector, 4.0% allocated to metallurgy, 2.5% to food industry and 2.3% to machine-building.
Source: Federal Service of State Statistics.
Investment activity went down in 2009 by indicating 16.2% fall (9.8% increment in 2008). The total size of gross fixed investment (less VAT), including small business and households, amounted to RUR7930.3 bn in 2009 (USD250.3 bn).
The share of foreign investment in the RF gross fixed investment (less VAT), excluding small business and households, is 4.6% in 2009 compared to 4.3% in 2008.
Table 4 Gross Fixed Investment, by Source of Financing: 2003-2009 (per cent distribution)
|
|
2003
|
2004
|
2005
|
2006
|
2007
|
2008
|
2009
|
| Total investments1 |
100.0
|
100.0
|
100.0
|
100.0
|
100.0
|
100.0
|
100.0
|
|
of which from:
|
|
|
|
|
|
|
|
|
Budget sources
|
19.6
|
17.4
|
20.1
|
19.8
|
21.2
|
21.0
|
21.5
|
| Non-budget sources |
80.4
|
82.6
|
79.9
|
80.2
|
78.8
|
79.0
|
78.5
|
|
Enterprises’ own funds
|
45.2
|
46.8
|
47.7
|
44.3
|
41.5
|
40.0
|
36.32
|
1. Large and medium size enterprises only.
2. Of which disposable income accounts for 14.8%, amortization – 18.7%.
Source: Federal Service of State Statistics.
Material production trends
Index of Russia’s industrial output in 2009 is equal to 89.2 as compared with 102.1 in 2008. Industrial production reached RUR21484 bn (USD678.2 bn) in current prices in 2009.
Output of minerals amounted to RUR4948 bn (USD156.2 bn) and fell by 1.2% in real terms in 2009 compared to its rise at 0.2% in 2008, while production of fuels fell by 0.6% (down by 0.2% in 2008) and extraction of other minerals decreased by 6.2% (up by 1.5% in 2008).
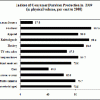
Production in manufacturing industries reached RUR13625 bn (USD430.1 bn) in 2009. Industrial fall in the manufacturing industries was 16.0% in 2009 as against the growth at 3.2% in 2008. Industrial fall was less than in average in such industries as food industry – 0.5%, output of coke and oil products – 0.6%, production of wood pulp and paper – 2.0%, production of leather and footwear – 2.0%, output of chemicals – by 5.4%, plastic and rubber wares – by 12.2%, metals and metal wares – by 13.9%, textile and apparel went down by 15.8%. Output of timber and wooden wares went down by 17.7%, construction materials – by 24.8%, machines and equipment – by 28.4%, electric, electronic and optical equipment – by 31.6%, vehicles even – by 38.0% in 2009.
Output and distribution of electricity, thermal energy, natural gas and water amounted to RUR2911 bn (USD91.9 bn) and fell by 4.8% in 2009 compared to its rise at 1.4% in 2008.
Figure 5
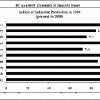
Figure 6
Construction activity is valued in 2009 at RUR3869.1 bn (USD122.1 bn) demonstrating fall at 16.0% in constant prices compared to 2008 when there was growth at 12.8%. Backlog of construction orders was 0.9 months as on January 1, 2010 compared to 1.3 months a year ago.
Russian agricultural output in 2009 reached RUR2251.7 bn (USD71.1 bn) or went up by 1.2% compared to its rise by 10.8% in 2008. In 2009 grain crops in Russia reached 97.0 million tons or by 10.3% less than a year before. Production of sugar beets was 24.8 million tons in 2009 (14.4% less than in 2008), sunflower seeds – 6.4 million tons (12.6% less), potatoes – 31.1 million tons (7.9% more), vegetables – 13.4 million tons (3.6% more). The RF customs statistics fixed rise in wheat exports to 16826.8 thousand t in 2009 compared to 11762.7 thousand t in 2008.
By January 1, 2010 overall cattle population in all types of farms was estimated at 20.7 million (by 1.5% less than a year before), including cows – 9.0 mln (by 1.2% less); population of pigs totaled 17.3 mln (by 6.7% more), sheep and goats – 22.1 mln (by 1.9% more). The share of small individual farms in overall population of cattle amounted to 47.7%, pigs – 34.3%, sheep and goats – 50.6% (as of January 1, 2009 – 47.3%, 37.9%, 50.6%, accordingly). Russia’s live-stock farming does not meet domestic requirements in animal produce, as before. But in 2009 the RF total imports of all kinds of meat, including poultry meat, went down to 2422.8 thousand t from 2934.8 thousand t in 2008. Russia’s imports of meat amounted to about 30% of Russia’s total meat consumption in 2009.
Table 5 Livestock Sector, Selected Production Indicators: 2003-2009
| |
2005
|
2006
|
2007
|
2008
|
QI-Q3 20091
|
| Meat (in slaughter weight, stock and poultry), million tons |
4.6
|
4.8
|
5.2
|
5.6 (106.5)
|
6.0 (106.6)
|
| Milk, million tons |
31.0
|
31.1
|
32.2
|
32.4 (101.1)
|
32.6 (100.7)
|
| Eggs, bn units |
37.1
|
38.0
|
37.8
|
37.8 (99.7)
|
39.4 (103.4)
|
1. Inbrackets – per cent change to 2008.
Source: Federal Service of State Statistics.